

Super-fun External Analysis (Pt.1)
- Mar 7, 2015
- 1 min read

Do you know how difficult it is to find an image relevant to analytics that doesn't make you want to immediately fall asleep? IT'S DIFFICULT.
Fun fact: In 2004 a tax auditor in Finland died at his desk and despite there being 100 employees working there, it took them two days to figure out he was dead. That seemed more relevant before I wrote it. Whatever.
So basically this is an analysis of the external environment to help inform decisions about location and whether the market could support this type of place. I broke it down into the three most densely populated areas. Once I'm done with all the parts I'll do some interpretation and decide a general location for the venue.
Here ya go. Have some numbers.
GENERAL ENVIRONMENT: ( * indicates an approximation)
Greensboro & Winston-Salem, Charlotte, Durham & Raleigh.
Demographic Segment
Population size: 516,080, 792,862, 677,221,
Population trend (since 2000): +25.6%* +46.6% + 39.2%*
Pop. Increase 2012 - 2013: +1.0%* +2.4% +2.2%*
Population ages 20-44: 189,917, 323,487, 252,603,
Sex offenders: 862 907 1,505
College/Univ. pop. (25 miles): 81,658, 76,712, 132,783,
Democratic vote: 55.7% 60.8% 62.3%
Religiously affiliated: 48.4% 48.0% 42.1%
Economic Segment
Median income: $38,336* $50,950 $51,332*
Med. inc. trend (since 2000): -0.1%* +8.5% +17.4%*
Unemployment: 6.5%* 6.0% 4.9%*
GDP Trend:
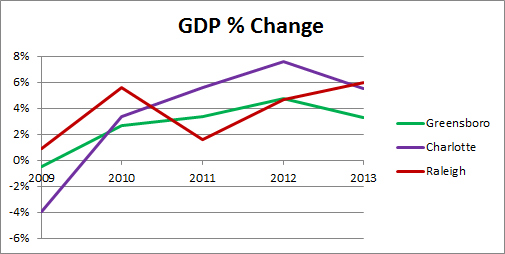
Hey. Don't worry. You won't see any more graphs for a while.


Comments